Dual-Energy X-Ray Absorptiometry (DXA) of Osteoporosis
Courtesy of Intermountain Medical Imaging, Boise, Idaho.
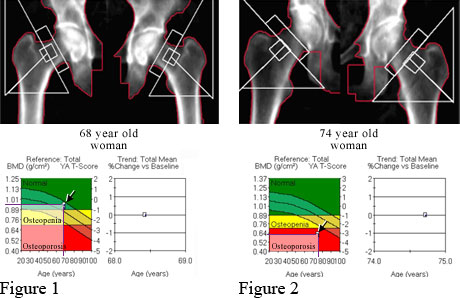
Figure 1 shows a bone density test of a healthy older woman. The X-ray shows normal hipbones. The graph shows the bone density number in the green zone (normal).
Figure 2 shows a bone density test of an older woman who has osteoporosis. The X-ray shows weaker hipbones. The graph shows the bone density number in the red zone (osteoporosis), placing her at much greater risk for broken bones (fractures).
Current as of: November 7, 2018
Author: Healthwise Staff
Medical Review:Anne C. Poinier, MD – Internal Medicine & Martin J. Gabica, MD – Family Medicine & Kathleen Romito, MD – Family Medicine & Carla J. Herman, MD, MPH – Geriatric Medicine